Response to Request for Information as Published in Remedial Investigation Report
Habitat (RI section 3.1.7)
Situated between Brooklyn and Queens, Newtown Creek and its tributaries provide a unique and locally important shallow water habitat for a variety of species from crabs and fish to birds and mammals (see Section 3.1.8). The aquatic habitat is mostly subtidal, supporting benthic macroinvertebrates (dominated by oligochaetes [segmented worms]), polychaetes (bristle worms; Nereis virens), amphipods (small crustaceans), epibenthic invertebrates such as crabs and bivalves, and resident fish such as mummichog (Fundulus heteroclitus), as well as limited use by non-resident migratory fish such as striped bass (Morone saxatilis). Intertidal areas that could provide additional foraging habitat for fish, crabs, birds, and mammals, are mostly confined to the headwaters of Maspeth Creek.
At low tide, approximately 5% of the Study Area could potentially provide forage habitat for sediment-probing birds or birds that forage by wading in shallow water (see Section 2.1.3 of Appendix I). Of that, 68% is within sediment mounds or “mud flats” located in the vicinity of some active outfalls and bulkheaded areas; the remaining 32% is made up of riprap or narrow strips of shoreline. Due to the semidiurnal tidal patterns in the Study Area, forage habitat for these sediment-probing and wading birds decreases rapidly as the tide rises and is close to 0% at high tide. In contrast, available forage habitat increases during high tide for fish, crabs, and birds such as the double-crested cormorant (Phalacrocorax auritus) that forage by swimming and diving.
For mammals such as the raccoon (Procyon lotor), access to the intertidal areas is limited in some areas due to the vertical bulkheads and other anthropogenic features along the shoreline, although raccoons may have some access behind and under bulkheads. Submerged macrophytes were occasionally observed floating in the Study Area near the East River (e.g., sea lettuce [Ulva lactuca]), or attached to pilings and riprap (e.g., green algae [Enteromorphia] and brown algae [Desmarestia]), but none were observed rooted in the Study Area sediment.
The only rooted emergent aquatic macrophytes observed during the Phase 2 sampling were patches of non-native common reed (Phragmites australis) toward the head of Maspeth Creek. The lack of an aquatic macrophyte community in the Study Area could be due to a number of physical attributes such as limited sloped areas due to the vertical nature of the shoreline, wave action from daily boat and barge traffic, and high turbidity leading to sunlight limitations and reduced photosynthesis, as well as contaminants. These attributes, in combination, likely limit the establishment and growth of macrophytes (see Section 2.1.3 of Appendix I).
Historically, Newtown Creek and its tributaries have been impacted by industrial discharges, municipal discharges, and spills. As described in Section 3.2.6.15, by the late 1880s, numerous oil refineries were operating along the creek, and additional manufacturing operations followed into the beginning of the twentieth century. These included petrochemical plants; animal rendering operations, such as fertilizer and glue factories; copper smelting; sugar refining; pencil manufacturing; manufactured gas production; sawmills; and lumber and coal yards.
Direct discharge to Newtown Creek was the primary method for disposal of stormwater, sewage, and industrial wastewater prior to the early twentieth century. Historical industrial discharges included waste liquor from grease vats and digesters at fertilizer and fat rendering facilities; oily wash water generated during the kerosene treating process at refineries; condensate from exhaust hoods at varnish and printing works; effluent from air-scrubbing systems; and cooling water, plating wastes, and plant clean-up water from the manufacture of electrical wiring devices (BPL 1890; Hazen and Sawyer 1960; Hurley 1994; NYSL 1900; Baker and Kent 1887).
Early municipal sewer systems also discharged directly to the creek. In the late 1800s and the first half of the 1900s, direct discharges from sewers operated by NYC regularly added raw sewage and other pollutants into the creek. By 1910, intercepting sewers (i.e., interceptors) had been constructed in some areas near the creek to convey flows to the East River where they were discharged without treatment. However, stormwater, sewage, and industrial wastewater continued to discharge to the creek via relief outfalls in areas without interceptors and when the capacity of the interceptor pipes was exceeded (Metropolitan Sewerage Commission of New York 1910; Board of Water Commissioners 1867; War Department 1891, 1915, 1936a; USEPA 2011).
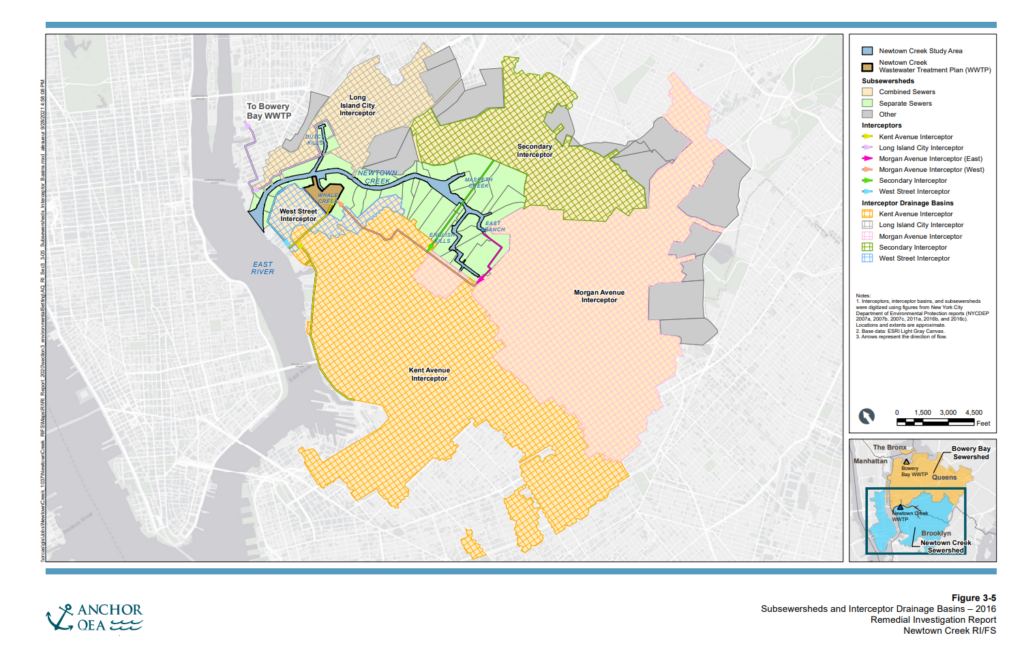
Since 1967, when the Newtown Creek WWTP began operating, stormwater (from areas served by combined sewer systems), sewage, and industrial wastewater flows have been conveyed to either the Bowery Bay WWTP or Newtown Creek WWTP for treatment prior to discharge outside the Study Area. However, in some portions of the Study Area, direct discharges of stormwater from private sites and MS4s, as well as CSOs, continued and are ongoing today (see Figure 3-5 and Section 3.2.8 for more details on discharges to Newtown Creek).
As discussed in Section 5 of this RI Report and Section 2.1.3.4 of Appendix E, annual CSO discharge to the creek is approximately 1,600 million gallons (MG). Bypasses may also occur during dry weather when the combined sewer infrastructure malfunctions (NYCDEP 2011c, 2012b, 2013a, 2014b, 2015, 2016a). These dry weather bypasses are infrequent, short-term discharges and result in discharge of a small volume compared to that of the wet weather CSO discharges. In areas not served by combined sewers, direct discharges of stormwater from MS4s (330 MG annually) to Newtown Creek are ongoing.
As documented by NYC, CSO discharges have likely contributed to subtidal surface sediment with an organic carbon (OC) content greater than 3 wt%, which may contribute to impairment of the benthic macroinvertebrate community in Newtown Creek (Hyland et al. 2000 as cited in NYCDEP 2011a). The bacterial decomposition of organic matter results in a decrease in DO and an increase of toxic byproducts such as ammonia and sulfide (Diaz and Rosenberg 1995; Hyland et al. 2005; Norton et al. 2002; Pelletier et al. 2011). DO below 2 milligrams per liter (mg/L) results in hypoxic conditions that adversely affect the respiration of benthic macroinvertebrates (CENR 2010; Gray et al. 2002; Brown et al. 2000) and can result in local extinction, except within the microbial community (CENR 2010; Llanso 1992).
This is made worse during the summer months when water temperatures are elevated and the bacterial degradation of organic matter is accelerated (Gray et al. 2002). During the summer Phase 1 surveys in 2012, surface water DO at depth fell below the New York State Class SD threshold of 3 mg/L, particularly in the tributaries; the benthic macroinvertebrate community was impaired even further, with no macroinvertebrates found in surface sediment at tributary stations (see Appendix I). A series of infrastructure projects are being completed by NYC in the Newtown Creek sewershed to address CWA requirements such as surface water DO. These projects include the installation of an aeration system in certain areas of Newtown Creek and a CSO long-term control plan (LTCP; see Section 3.2.8.3.1).
Discharges to Newtown Creek (RI section 3.2.8)
As discussed in the preceding subsections of Section 3, many decades of urban development along the creek and in the surrounding upland areas have altered the hydrology of the watershed draining to Newtown Creek. The tributaries and adjacent marsh areas were filled, and large portions of the surrounding neighborhoods were covered with impervious surfaces (i.e., buildings, pavement). Over time, tributary flows to Newtown Creek were eliminated and replaced by point source and overland flow discharges.
In the 1800s and early 1900s, untreated stormwater, sewage, and industrial wastewater were generally discharged directly to Newtown Creek. Although the present-day system of intercepting sewers (i.e., interceptors) were conveying flows to the Bowery Bay WWTP and Newtown Creek WWTP by 1967, direct discharges of stormwater and CSOs to the creek continued and are ongoing today. The deleterious effects of point source discharges on water quality in Newtown Creek were noted by public health officials, engineers, and others as early as the late 1800s (City of Brooklyn 1897; Metropolitan Sewerage Commission 1910; Hazen and Sawyer 1960).
Interceptor sewers were constructed in the early 1900s to convey flows in Brooklyn and Queens to the East River, although sewer flow continued to discharge to Newtown Creek via relief outlets and storm overflows (Metropolitan Sewerage Commission 1910). The Newtown Creek WWTP, Bowery Bay WWTP, and the present-day system of intercepting sewers had been constructed by 1967. CSOs, consisting of wastewater (e.g., sanitary sewage and industrial process water) and stormwater, continue to discharge to Newtown Creek when the capacity of the WWTP infrastructure is exceeded (Lang et al. 1974; NYCDEP 2011a). Stormwater discharges directly to the creek in areas served by MS4s.
Regulation of private and municipal point source discharges into Newtown Creek increased with the 1972 passage of the CWA and subsequent amendments, which established the National Pollutant Discharge Elimination System (NPDES) and State Pollutant Discharge Elimination System (SPDES) programs (NYCDEP 2011a). However, direct discharges to Newtown Creek are ongoing today. An overview of current and historical CSO discharges and regulation of CSO discharges to Newtown Creek is presented in this section and shown on the timeline in Figure 3-7. An LTCP for CSO discharges to Newtown Creek was approved on June 27, 2018 (NYSDEC 2018a).
Current point source discharges to the Study Area are individually permitted discharges, WWTP treated effluent overflows, 36 CSOs, and stormwater (including overland flow). Individually permitted discharges include treated effluent from groundwater remediation and dewatering systems, stormwater discharge from industrial sites, hydrostatic test water, and discharge from secondary containment. Stormwater discharges (including overland flow) are runoff from private, commercial, and industrial sites — and from roads and open spaces.
Distribution of Contaminants (RI section 4.2.3)
The following subsections present information on the distribution of contaminants in surface sediment. Each of the contaminants evaluated for nature and extent is presented in a separate subsection, with the subsections organized by chemical class, with hydrocarbons (TPAH [17], TPAH [34], C19-C36) presented first, followed by bioaccumulative organics (TPCB and 2,3,7,8-TCDD), metals (Cu and Pb).
TPAH (34) (RI section 4.2.3.2)
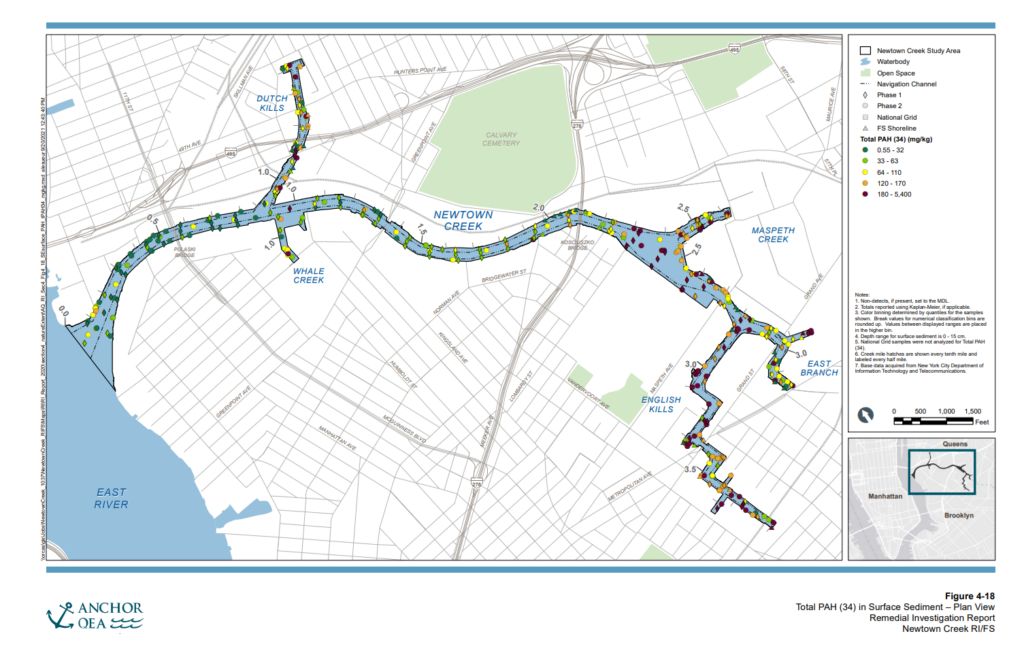
TPAH (34) concentrations in surface sediment in each reach of the Study Area and the reference areas (based on data collected in the 14 Phase 1 reference areas and the 4 Phase 2 reference areas) are summarized in Table 4-14. In addition, a plan view map, longitudinal profile, and box plot showing the data are provided in Figures 4-18 through 4-20, respectively. Arithmetic average TPAH (34) concentrations within the Study Area reaches are generally higher than those in the Phase 2 reference areas.
The range, arithmetic average, and median for each reach and notable patterns in the data are as follows (if patterns are not discussed, it means no notable patterns were observed):
- CM 0 – 1: TPAH (34) concentrations range from 3.7 to 1,000 mg/kg (arithmetic average = 49 mg/kg; median = 27 mg/kg) and are generally the lowest in the Study
Area (see Figure 4-20). - CM 1 – 2: TPAH (34) concentrations range from 1.1 to 180 mg/kg (arithmetic average = 56 mg/kg; median = 46 mg/kg). While the concentrations in this reach are generally higher than those in several reference areas, there is overlap.
- CM 2+: TPAH (34) concentrations range from 0.55 to 5,400 mg/kg (arithmetic average = 340 mg/kg; median = 120 mg/kg). The highest concentrations in the main
stem are observed in CM 2+. - English Kills: TPAH (34) concentrations range from 9.6 to 1,900 mg/kg (arithmetic average = 240 mg/kg; median = 130 mg/kg). Concentrations in the lower 0.5 mile of English Kills are among the highest in the Study Area. From there, concentrations are generally lower upstream to the head of the tributary.
- East Branch: TPAH (34) concentrations range from 3.4 to 690 mg/kg (arithmetic average = 130 mg/kg; median = 86 mg/kg) and are generally lower than those
measured in the adjacent area of CM 2+. - Maspeth Creek: TPAH (34) concentrations range from 11 to 900 mg/kg (arithmetic average = 170 mg/kg; median = 110 mg/kg) and are similar to the adjacent area of CM 2+.
- Dutch Kills: TPAH (34) concentrations range from 2.2 to 350 mg/kg (arithmetic average = 100 mg/kg; median = 92 mg/kg) and are higher than in the nearby main stem.
- Whale Creek: TPAH (34) concentrations range from 19 to 240 mg/kg (arithmetic average = 49 mg/kg; median = 27 mg/kg) and are similar to or somewhat higher than in the nearby main stem.
C19-C36 (RI section 4.2.3.3)
C19-C36 concentrations in surface sediment in each reach of the Study Area and the reference areas (based on data collected in the four Phase 2 reference areas) are summarized in Table 4-15. In addition, a plan view map, longitudinal profile, and box plot showing the data are provided in Figures 4-21 through 4-23, respectively. C19-C36 was not analyzed in the Phase 1 or National Grid sampling programs; as such, there are fewer data available for this chemical in the Study Area and reference areas as compared to other chemicals. Nonetheless, the C19-C36 dataset is still large enough to support evaluations of nature and extent (it includes surface sediment samples from 240 Study Area locations and 40 reference area locations). Arithmetic average C19-C36 concentrations within the Study Area exceed Phase 2 reference area concentrations with the exception of CM 0 – 1 and CM 1 – 2.
The range, arithmetic average, and median for each reach and notable patterns in the data are as follows (if patterns are not discussed, it means no notable patterns were observed):
- CM 0 – 1: C19-C36 concentrations range from 16 to 250 mg/kg (arithmetic average = 65 mg/kg; median = 53 mg/kg). Surface sediment C19-C36 concentrations in CM 0 – 1 are generally the lowest in the Study Area (see Figure 4-23).
- CM 1 – 2: C19-C36 concentrations range from 23 to 1,000 mg/kg (arithmetic average = 210 mg/kg; median = 190 mg/kg). Concentrations in this reach are somewhat higher than those in CM 0 – 1 and increase in the upstream direction, especially at the upstream end of this reach (e.g., upstream of CM 1.8).
- CM 2+: C19-C36 concentrations range from 27 to 58,000 mg/kg (arithmetic average = 2,500 mg/kg; median = 920 mg/kg). A general increase in concentration from downstream to upstream is observed in this reach. The highest concentrations in the main stem are observed in CM 2+.
- English Kills: C19-C36 concentrations range from 7.7 to 31,000 mg/kg (arithmetic average = 2,900 mg/kg; median =1,500 mg/kg). Concentrations are similar to or higher than those measured in the adjacent area of CM 2+.
- East Branch: C19-C36 concentrations range from 35 to 7,300 mg/kg (arithmetic average = 2,000 mg/kg; median = 1,800 mg/kg). Concentrations are similar to those measured in the adjacent area of CM 2+.
- Maspeth Creek: C19-C36 concentrations range from 38 to 39,000 mg/kg (arithmetic average = 3,900 mg/kg; median = 1,200 mg/kg). Concentrations are similar to those measured in the adjacent area of CM 2+.
- Dutch Kills: C19-C36 concentrations range from 96 to 6,800 mg/kg (arithmetic average = 1,500 mg/kg; median = 1,300 mg/kg) and are substantially higher than those in the nearby main stem.
- Whale Creek: C19-C36 concentrations range from 91 to 960 mg/kg (arithmetic average = 500 mg/kg; median = 440 mg/kg) and are higher than in the nearby main stem.

TPCB (RI section 4.2.3.4)
TPCB concentrations in surface sediment in each reach of the Study Area and the reference areas (including data from the 14 Phase 1 reference areas and the 4 Phase 2 reference areas) are summarized Table 4-16. In addition, a plan view map, longitudinal profile, and box plot showing the data are provided in Figures 4-24 through 4-26, respectively. Arithmetic average TPCB concentrations within the Study Area reaches are similar to those in all or some of the Phase 2 reference areas in CM 0 – 1 and CM 1 – 2, respectively, and generally exceed those for the reference areas elsewhere.
The range, arithmetic average, and median for each reach and notable patterns in the data are as follows (if patterns are not discussed, it means no notable patterns were observed):
- CM 0 – 1: TPCB concentrations range from 0.12 to 3.0 mg/kg (arithmetic average = 0.67 mg/kg; median = 0.62 mg/kg) and are generally the lowest in the Study Area (see Figure 4-26).
- CM 1 – 2: TPCB concentrations range from 0.098 to 3.0 mg/kg (arithmetic average = 1.1 mg/kg; median = 1.0 mg/kg) and are somewhat higher than in CM 0 – 1. While the concentrations in this reach are generally higher than those in several reference areas, there is overlap.
- CM 2+: TPCB concentrations range from 0.019 to 160 mg/kg (arithmetic average = 11 mg/kg; median = 6.5 mg/kg). An increase in concentration is observed above CM 2. The highest concentrations in the main stem are observed in CM 2+.
- English Kills: TPCB concentrations range from 0.11 to 63 mg/kg (arithmetic average = 12 mg/kg; median = 8.1 mg/kg). Concentrations in the lower 0.5 mile of English Kills are among the highest in the Study Area, but then decline upstream to the head of the tributary.
- East Branch: TPCB concentrations range from 0.024 to 16 mg/kg (arithmetic average = 2.4 mg/kg; median = 1.1 mg/kg). Concentrations are lower than in the adjacent area of CM 2+ and decline upstream to the head of the tributary.
- Maspeth Creek: TPCB concentrations range from 0.29 to 25 mg/kg (arithmetic average = 3.1 mg/kg; median = 1.4 mg/kg). Concentrations are lower than in the adjacent area of CM 2+ and do not exhibit a gradient, except for two higher values in the middle of the tributary.
- Dutch Kills: TPCB concentrations range from 0.015 to 380 mg/kg (arithmetic average = 15 mg/kg; median = 2.3 mg/kg). The majority of observed concentrations generally range from 1 to 10 mg/kg throughout the tributary, with the highest surface sediment TPCB concentration in the Study Area of 380 mg/kg located 0.2 mile upstream of the confluence with the main stem.
- Whale Creek: TPCB concentrations range from 0.36 to 3.4 mg/kg (arithmetic average = 1.4 mg/kg; median = 1.4 mg/kg). Concentrations are similar to the nearby main stem and do not exhibit a strong gradient, although concentrations tend to be higher closer to the head of the tributary.

2,3,7,8-TCDD (RI section 4.2.3.5)
2,3,7,8-TCDD concentrations in surface sediment in each reach of the Study Area and the reference areas (including data from only the 4 Phase 2 reference areas) are summarized in Table 4-17. In addition, a plan view map, longitudinal profile, and box plot showing the data are provided in Figures 4-27 through 4-29, respectively. Arithmetic average 2,3,7,8-TCDD concentrations within the Study Area are generally consistent with those in the Phase 2 reference areas for some reaches (CM 0 – 1, East Branch, and Maspeth Creek), and generally exceed those for the reference areas elsewhere.
The range, arithmetic average, and median for each reach and notable patterns in the data are as follows (if patterns are not discussed, it means no notable patterns were observed):
- CM 0 – 1: 2,3,7,8-TCDD concentrations range from 0.85 to 11 nanograms per kilogram (ng/kg; arithmetic average = 5.4 ng/kg; median = 5.5 ng/kg) and are among the lowest in the Study Area.
- CM 1 – 2: 2,3,7,8-TCDD concentrations range from 0.33 to 23 ng/kg (arithmetic average = 7.8 ng/kg; median = 7.5 ng/kg) and are slightly higher than in CM 0 – 1.
- CM 2+: 2,3,7,8-TCDD concentrations range from 0.064 to 49 ng/kg (arithmetic average = 11 ng/kg; median = 9.0 ng/kg). An increase in concentration is observed above CM 2. The highest concentrations in the main stem are observed in CM 2+.
- English Kills: 2,3,7,8-TCDD concentrations range from 0.16 to 26 ng/kg (arithmetic average = 7.7 ng/kg; median = 6.0 ng/kg). Concentrations in the lower 0.5 mile of English Kills are among the highest in the Study Area, but then decline upstream to the head of the tributary.
- East Branch: 2,3,7,8-TCDD concentrations range from 0.12 to 14 ng/kg (arithmetic average = 3.2 ng/kg; median = 2.3 ng/kg). Concentrations near the confluence with the main stem are slightly higher than in the adjacent area of CM 2+ and decline upstream to the head of the tributary.
- Maspeth Creek: 2,3,7,8-TCDD concentrations range from 0.85 to 8.3 ng/kg (arithmetic average = 2.9 ng/kg; median = 2.7 ng/kg). Concentrations are lower than in the adjacent area of CM 2+.
- Dutch Kills: 2,3,7,8-TCDD concentrations range from 0.10 to 16 ng/kg (arithmetic average = 4.8 ng/kg; median = 3.6 ng/kg). Concentrations near the confluence with the main stem are slightly higher than in the adjacent area of the main stem, and then decline upstream to the head of the tributary.
- Whale Creek: 2,3,7,8-TCDD concentrations range from 4.8 to 65 ng/kg (arithmetic average = 19 ng/kg; median = 11 ng/kg). Concentrations near the confluence with the main stem are generally similar to the nearby main stem, but then increase upstream to the head of the tributary. Concentrations closer to the head of the tributary are among the highest in the Study Area and result in this tributary exhibiting the highest average concentration of any reach.

Cu (RI section 4.2.3.6)
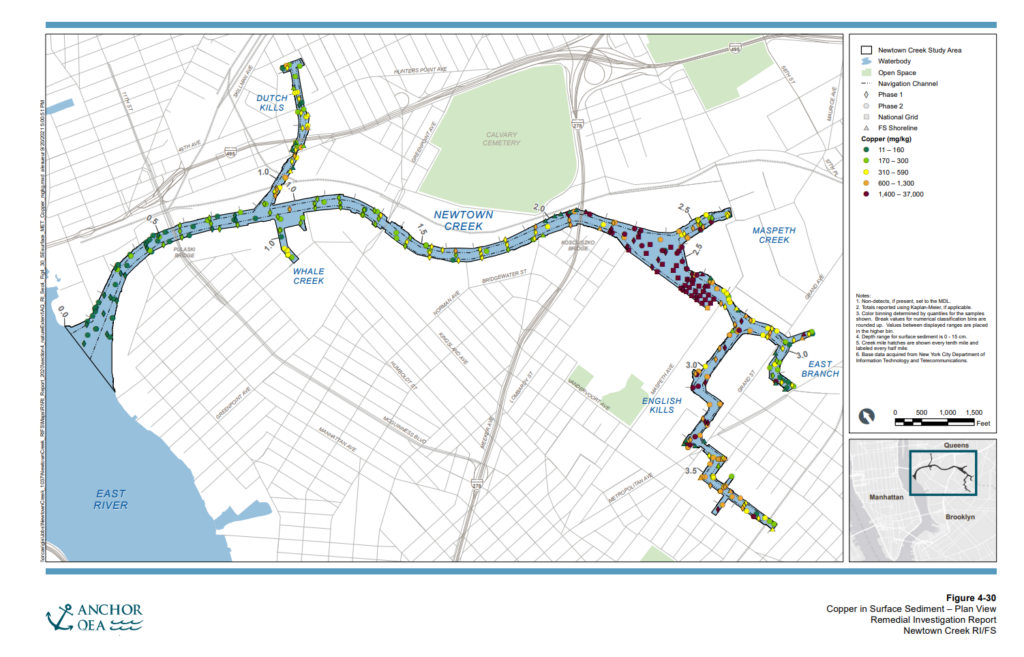
Cu concentrations in surface sediment in each reach of the Study Area and the reference areas (based on data collected in the 14 Phase 1 reference areas and the 4 Phase 2 reference areas) are summarized in Table 4-18. In addition, a plan view map, longitudinal profile, and box plot showing the data are provided in Figures 4-30 through 4-32, respectively. Arithmetic average Cu concentrations are similar to those in the Phase 2 reference areas for CM 0 – 1, and generally exceed those for the reference areas elsewhere.
The range, arithmetic average, and median for each reach and notable patterns in the data are as follows (if patterns are not discussed, it means no notable patterns were observed):
- CM 0 – 1: Cu concentrations range from 11 to 780 mg/kg (arithmetic average = 140 mg/kg; median = 120 mg/kg). Surface sediment Cu concentrations in CM 0 – 1 are generally the lowest in the Study Area (see Figure 4-32). Concentrations increase moving upstream with distance from the mouth.
- CM 1 – 2: Cu concentrations range from 60 to 650 mg/kg (arithmetic average = 290 mg/kg; median = 270 mg/kg). Concentrations continue to increase in the upstream direction.
- CM 2+: Cu concentrations range from 39 to 37,000 mg/kg (arithmetic average = 3,300 mg/kg; median = 2,200 mg/kg). An increase in concentration is observed above CM 2. The highest concentrations in the main stem are observed in CM 2+ at approximately CM 2.3.
- English Kills: Cu concentrations range from 60 to 4,300 mg/kg (arithmetic average = 860 mg/kg; median = 720 mg/kg). Concentrations are lower on average than concentrations measured in CM 2+, but are generally within the same range. Concentrations decline upstream to the head of the tributary.
- East Branch: Cu concentrations range from 32 to 6,300 mg/kg (arithmetic average = 570 mg/kg; median = 310 mg/kg). Concentrations are generally lower than the concentrations measured in CM 2+ and decline upstream to the head of the tributary.
- Maspeth Creek: Cu concentrations range from 72 to 5,900 mg/kg (arithmetic average = 730 mg/kg; median = 400 mg/kg). Concentrations are generally lower than in the adjacent area of CM 2+ and decline upstream to the head of the tributary.
- Dutch Kills: Cu concentrations range from 13 to 850 mg/kg (arithmetic average = 360 mg/kg; median = 350 mg/kg). Based on Figure 4-31b, concentrations are generally consistent throughout this tributary.
- Whale Creek: Cu concentrations range from 81 to 530 mg/kg (arithmetic average = 300 mg/kg; median = 280 mg/kg). Based on Figure 4-31b, concentrations aregenerally consistent throughout this tributary.
Pb (RI section 4.2.3.7)
Pb concentrations in surface sediment in each reach of the Study Area and the reference areas (based on data collected in the 14 Phase 1 reference areas and the 4 Phase 2 reference areas) are summarized in Table 4-19. In addition, a plan view map, longitudinal profile, and box plot showing the data are provided in Figures 4-33 through 4-35, respectively. Arithmetic average Pb concentrations within the Study Area reaches are similar to those in the Phase 2 reference areas in CM 0 – 1 and CM 1 – 2, and generally exceed those for most reference areas elsewhere.
The range, arithmetic average, and median for each reach and notable patterns in the data are as follows (if patterns are not discussed, it means no notable patterns were observed):
- CM 0 – 1: Pb concentrations range from 10 to 750 mg/kg (arithmetic average = 130 mg/kg; median = 120 mg/kg). Surface sediment Pb concentrations in CM 0 – 1 are generally the lowest in the Study Area. Concentrations increase moving upstream with distance from the mouth.
- CM 1 – 2: Pb concentrations range from 34 to 3,100 mg/kg (arithmetic average = 270 mg/kg; median = 200 mg/kg). Concentrations continue to increase in the upstream direction.
- CM 2+: Pb concentrations range from 25 to 3,400 mg/kg (arithmetic average = 680 mg/kg; median = 600 mg/kg). An increase in concentration is observed above CM 2. The highest concentrations in the main stem are observed in CM 2+.
- English Kills: Pb concentrations range from 100 to 1,400 mg/kg (arithmetic average = 680 mg/kg; median = 640 mg/kg). Concentrations are similar to those measured in the adjacent area of CM 2+.
- East Branch: Pb concentrations range from 39 to 1,100 mg/kg (arithmetic average = 410 mg/kg; median = 380 mg/kg). Concentrations are similar to those measured in the adjacent area of CM 2+. Concentrations near the confluence with the main stem are generally consistent with the adjacent main stem.
- Maspeth Creek: Pb concentrations range from 56 to 1,300 mg/kg (arithmetic average = 370 mg/kg; median = 310 mg/kg). Concentrations are generally lower than in the adjacent area of CM 2+.
- Dutch Kills: Pb concentrations range from 9.0 to 1,200 mg/kg (arithmetic average = 440 mg/kg; median = 400 mg/kg). Concentrations generally decline slightly upstream to the head of the tributary.
- Whale Creek: Pb concentrations range from 76 to 430 mg/kg (arithmetic average = 240 mg/kg; median = 210 mg/kg). Concentrations are similar to (or greater than) the nearby main stem.
